
Kurt Warner’s retirement hurt Cardinals worse than you think
Jan 29, 2013, 8:18 PM | Updated: Jan 30, 2013, 12:16 am


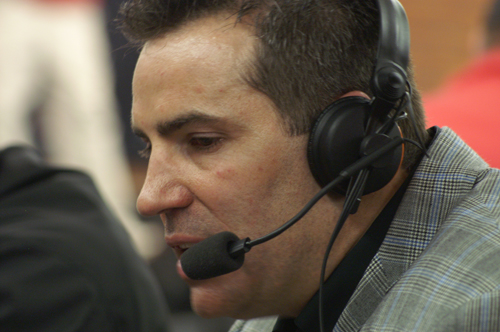
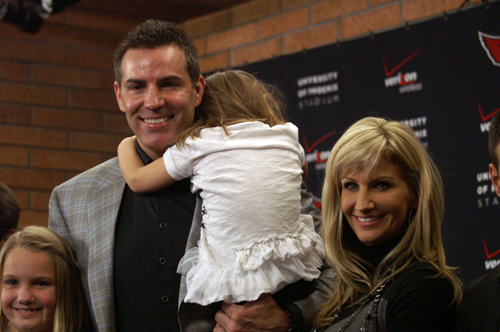
I’m sure this isn’t the first time you’ve read a reference to the fact that it was three years ago — January 29, 2010 — that Arizona Cardinals quarterback Kurt Warner hung up his cleats after a stellar 12-year NFL career.
Unfortunately, it will be the most painful reminder of that event.
It hurt at the time. The Cardinals were not only relevant for the first time since they had moved to the Valley from St. Louis in 1988, they were among the best and most exciting teams in the league.
Most who followed the team in any capacity knew there would be a drop off from the production at the quarterback position after Warner’s exodus. But you would have had to be Nostradamus after LASIK surgery to see at the time how badly the position would suffer.
In Warner’s last three seasons as a Cardinal, he completed 65.4 percent (1,021-of-1,562) of his passes for 11,753 yards with 83 touchdowns and only 45 interceptions. In that time span, Warner was 24-18 as a starter while guiding the Cardinals to back-to-back NFC West titles and an appearance in Super Bowl XLIII.
I’m not breaking any news here, but the three years that have followed have been a quarterbacking disaster.
Don’t believe me? Look at the numbers. The Cardinals are 18-30 since Warner’s retirement, which is the fifth-worst record in the league in that span.
But concentrating just on QB play, Arizona has been even worse. The six-headed monster (comprised of Derek Anderson, Max Hall, John Skelton, Kevin Kolb, Ryan Lindley and Brian Hoyer) has completed 929-of-1,719 passes for 10,601 yards with 42 touchdowns and 63 interceptions.
They combined to complete only 54 percent of their passes, the worst in the league over the three-season span (the Jets are next-worst at 55.6 percent.) They’ve combined to throw only 42 touchdown passes in 48 regular season games — the worst mark in the league. To put that in perspective, Drew Brees of the New Orleans Saints has thrown more than that in each of the last two regular seasons!
Compounding the lack of touchdown passes is the number of interceptions Cardinals quarterbacks have thrown — 63, tied for the most in the league with Buffalo. The Cardinals are one of only four teams along with Carolina, Minnesota and Cleveland, with a negative touchdown-to-interception ratio, and their mark (-21) is 17 picks worse than the second-worst team.
And then we come to the all-important stat of Passer Rating. While, predictably, teams like Green Bay (109.99), New England (103.94) and New Orleans (99.22) top the list, the Cardinals bring up the rear with a paltry figure of 65.69 — by far the worst in the league since the beginning of the 2011 season. Second-worst? Jacksonville, with a rating of 73.53.
Sorry I had to be the one to crystallize the ineptitude of Cardinals quarterbacks in the last three years. Sure, you had a good idea about it already, but still.
The bad news is the Cardinals still haven’t found a solution at the position heading into the 2013 season.
NFL PASSING STATS 2010-2012
| TEAM | COMP | ATT | COMP % | YARDS | TD | INT | TD/INT RATIO |
PASSER RATING |
3-YEAR RECORD |
|---|---|---|---|---|---|---|---|---|---|
| ARIZONA | 929 | 1719 | .540 | 10601 | 42 | 63 | -21 | 65.69 | 18-30 |
| ATLANTA | 1148 | 1786 | .643 | 12809 | 89 | 36 | +53 | 93.74 | 36-12 |
| BALTIMORE | 956 | 1595 | .599 | 11254 | 68 | 33 | +35 | 87.02 | 34-14 |
| BUFFALO | 961 | 1608 | .598 | 10658 | 72 | 63 | +9 | 78.10 | 16-32 |
| CAROLINA | 852 | 1493 | .571 | 10651 | 49 | 50 | -1 | 76.35 | 15-33 |
| CHICAGO | 831 | 1444 | .575 | 10041 | 62 | 57 | +5 | 76.88 | 29-19 |
| CINCINNATI | 1008 | 1665 | .605 | 11302 | 75 | 50 | +25 | 83.32 | 23-25 |
| CLEVELAND | 944 | 1614 | .585 | 10171 | 45 | 49 | -4 | 73.72 | 14-34 |
| DALLAS | 1189 | 1804 | .659 | 13653 | 91 | 50 | +40 | 93.81 | 22-26 |
| DENVER | 953 | 1597 | .597 | 11686 | 82 | 36 | +46 | 90.02 | 25-23 |
| DETROIT | 1251 | 2039 | .614 | 14211 | 89 | 49 | +40 | 86.79 | 20-28 |
| GREEN BAY | 1102 | 1651 | .667 | 13858 | 122 | 29 | +93 | 109.99 | 36-12 |
| HOUSTON | 1007 | 1595 | .631 | 12112 | 66 | 34 | +32 | 91.25 | 28-20 |
| INDIANAPOLIS | 1091 | 1841 | .593 | 12297 | 70 | 49 | +21 | 80.88 | 23-25 |
| JACKSONVILLE | 859 | 1524 | .564 | 9612 | 58 | 53 | +5 | 73.53 | 15-33 |
| KANSAS CITY | 846 | 1450 | .583 | 9414 | 48 | 46 | +2 | 75.57 | 19-29 |
| MIAMI | 908 | 1530 | .593 | 10605 | 50 | 47 | +3 | 78.51 | 20-28 |
| MINNESOTA | 891 | 1498 | .595 | 9517 | 52 | 55 | -3 | 74.39 | 19-29 |
| NEW ENGLAND | 1135 | 1760 | .645 | 14123 | 110 | 26 | +84 | 103.94 | 39-9 |
| NEW ORLEANS | 1345 | 1994 | .675 | 15328 | 122 | 55 | +67 | 99.22 | 31-17 |
| NY GIANTS | 1021 | 1667 | .612 | 12902 | 86 | 56 | +30 | 88.57 | 28-20 |
| NY JETS | 870 | 1565 | .556 | 10140 | 60 | 51 | +9 | 74.61 | 25-23 |
| OAKLAND | 970 | 1644 | .590 | 11882 | 62 | 55 | +7 | 80.00 | 20-28 |
| PHILADELPHIA | 1045 | 1733 | .603 | 12566 | 68 | 53 | +15 | 82.88 | 22-26 |
| PITTSBURGH | 993 | 1592 | .624 | 12235 | 70 | 38 | +32 | 90.80 | 32-16 |
| SAN DIEGO | 1063 | 1654 | .643 | 12976 | 83 | 48 | +35 | 92.96 | 24-24 |
| SAN FRANCISCO | 848 | 1387 | .611 | 10357 | 60 | 28 | +32 | 90.15 | 30-18 |
| SEATTLE | 882 | 1458 | .605 | 10214 | 56 | 44 | +12 | 81.91 | 25-23 |
| ST. LOUIS | 978 | 1696 | .577 | 10553 | 49 | 39 | +10 | 76.11 | 16-32 |
| TAMPA BAY | 982 | 1648 | .596 | 11546 | 70 | 47 | +23 | 83.21 | 21-27 |
| TENNESSEE | 844 | 1598 | .591 | 10968 | 63 | 45 | +18 | 81.32 | 21-27 |
| WASHINGTON | 986 | 1638 | .602 | 11985 | 64 | 51 | +13 | 82.78 | 21-27 |


Comments