
The hot start by the Diamondbacks’ bullpen: By the numbers
Beyond Archie Bradley, the Arizona Diamondbacks' bullpen has supported the equally-strong start to the season by the starters.

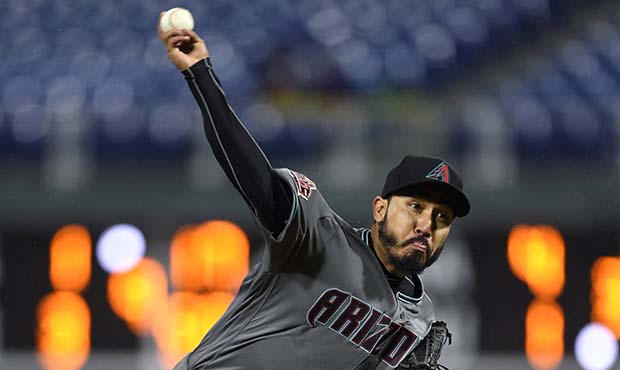
Arizona Diamondbacks' Fernando Salas throws during the fifth inning of a baseball game against the Philadelphia Phillies, Tuesday, April 24, 2018, in Philadelphia. The Diamondbacks won 8-4. (AP Photo/Derik Hamilton)
(AP Photo/Derik Hamilton)
Arizona Diamondbacks general manager Mike Hazen constructed his bullpen with stretches like this in mind.
Through the first 22 games of the year, a 16-6 record could strain bullpen arms used traditionally. The D-backs asked themselves, as humbly as possible: If closers close out wins, how would that wear on a primary relief pitcher or two amid a winning streak?
On Tuesday, the Diamondbacks beat the Philadelphia Phillies 8-4.
While the Arizona offense was led by contributions from the suspected weapons and a few others who had thus far struggled, starting pitcher Robbie Ray could only go 4.2 innings. And with the team’s two most high-pressure pitchers presumably resting, the D-backs earned the win with five relievers pushing them through the finish line.
It’s been that way all year despite a bit of turnover from the 2017 season.
Here’s a look at the collective effort of the Diamondbacks’ bullpen, by the numbers.
1.89
That’s the ERA by the Arizona relief crew, by far the best in MLB as of Wednesday morning. The next-best ERA by a bullpen is the Toronto Blue Jays at 2.28. Arizona has allowed 16 earned runs in 76.1 innings.
.193
Opposing hitters have a .193 batting average against Arizona, second-best in MLB.
5
What type of pitches are the D-backs’ relievers using? They rank fifth in percentage of fastballs thrown (63.9) and changeups tossed (15.0).
52.1
Arizona’s relievers aren’t striking out opponents at a high rate. Rather, they’re allowing those batters weak contact with a groundball percentage of 52.1, second-best in the majors.
.254
Those groundballs aren’t translating to runners on base. The Diamondbacks opponent batting average on balls in play (BABIP) is an MLB-low .254, a full .10 better than the league-worst White Sox at .354.
29
FanGraphs doesn’t reveal how it categorizes hard-hit balls, but it’s an algorithm based “on hang time, location, and general trajectory.” But only 29 percent of hit balls against D-backs relievers are hard-hit, sixth-lowest overall.
0.35
The preceding three statistics have translated to the second-lowest home run rate. The D-backs relievers are allowing just 0.35 homers per nine innings. For reference, 16 of 30 MLB teams allow at least 1.0 per nine frames.
8
The bullpen is walking just 8 percent of batters, fifth-best in MLB.
4.4
Though Arizona ranked in the middle of MLB in fly ball percentage (35.1), only 4.4 percent of those have been home runs allowed, second-best in MLB.
76.1
The good news is that the bullpen hasn’t been extremely taxed. Arizona ranks 20th in MLB by pitching the relievers 76.1 innings so far this season thanks to strong performances throughout by the starters. The least-used bullpen in MLB is that of the Cleveland Indians, which has pitched 58.1 innings, while the Los Angeles Angels relievers have pitched 105.1 frames.
Related
 D-backs beat Phillies, become first NL team to reach 16 wins
 Watch this dude lose his mind (and beer) after getting a D-backs HR ball
 Diamondbacks will not make a trade that leads to luxury tax penalties
 Diamondbacks going back to closer-by-matchups
 Diamondbacks lean on brilliant Eduardo Rodriguez effort to win key series over Pirates
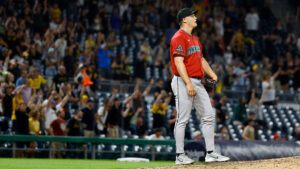 Is Paul Sewald on the closer hot seat for the Diamondbacks?

Comments
0 Comments